- Educação
- Análise Gráfica
- Análise de Candlestick (Velas)
Candlestick Analysis
Looking at a Japanese candlestick chart you can ask the question why this chart looks like this — black and white rectangles on the field? The idea for this chart came from 18th century Japan where the biggest rice traders used candles to see the rice price change. When the price had been changed, traders took a new candle and cut it. So the remaining piece of the candle was equal to the current price. The traders studied the candles and found the patterns that helped them to estimate future rice prices.
Later, in the early 90’s of the 20th century this chart was used by the brokers and Japanese rice traders’ knowledge was integrated into the modern exchange market. Thus the candlestick analysis appeared. The candlestick analysis uses different combinations of Japanese candlesticks to foresee future price movements.
The candlestick bars are rectangles with the upper and lower lines so they look like real candles. The rectangle is called a candlestick's real body and the lines are called its shadows.
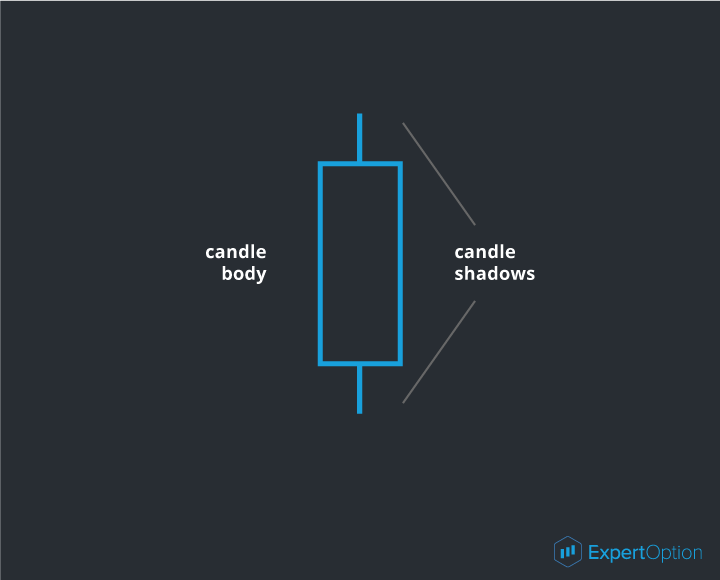
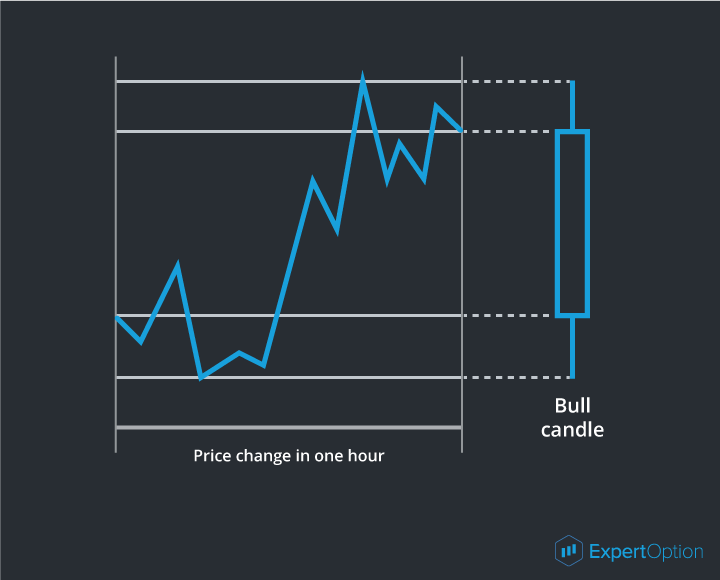
These rectangles include the following data:
• The open price, a price at the beginning of the interval.
• The high price, the maximum price during this interval.
• The low price, a minimum price during this interval.
• The close price, a price at the end of the interval.
So the candlestick is formed using four prices fixed in a definite time period.
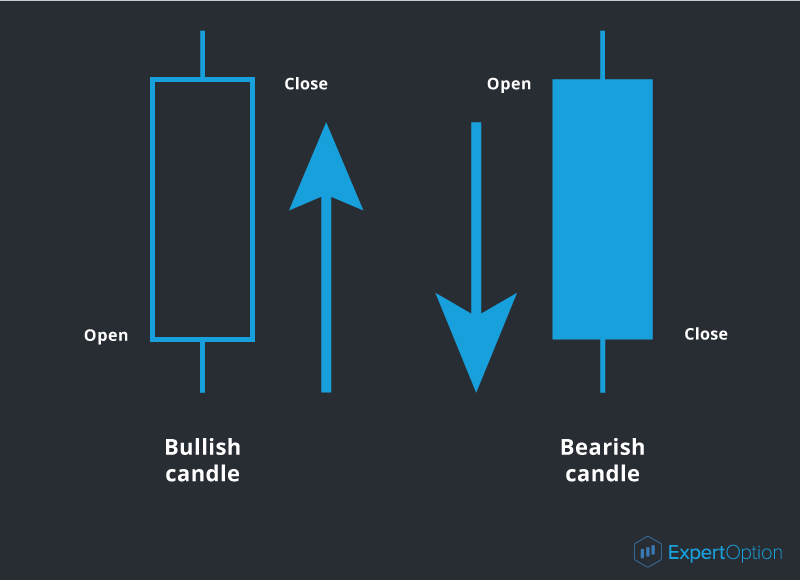
There are two types of candlesticks:
1. Bullish candlestick shows the price growth. An opening price is lower than a closing price.
2. Bearish candlestick shows the price fall. An opening price is higher than a closing price.
 s
s
Besides the basic candlesticks, there are also the squat candlesticks with the real bodies 3-4 times smaller than their shadows.
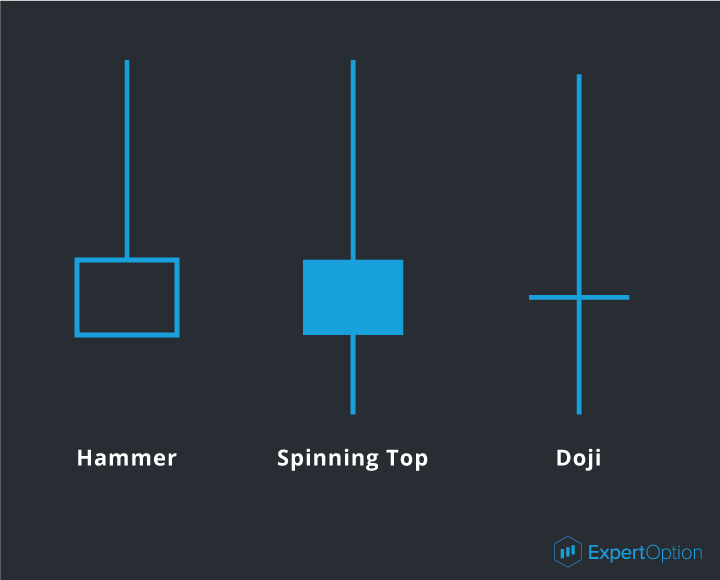
The squat candlestick shows that the market movement became slow and will reverse soon — the movement is not strong enough to continue and the candlestick's real body is small but the shadows are long because of the attempts to continue the movement in the market. If you see such a candlestick on the chart you should prepare for the current tendency reversal.
There is another candlestick pattern — the engulfing pattern which also gives the reversal signals. The engulfing pattern is the moment when a new candlestick appears and it's bigger than the previous one and has a reversal direction. You can see the example as follows:
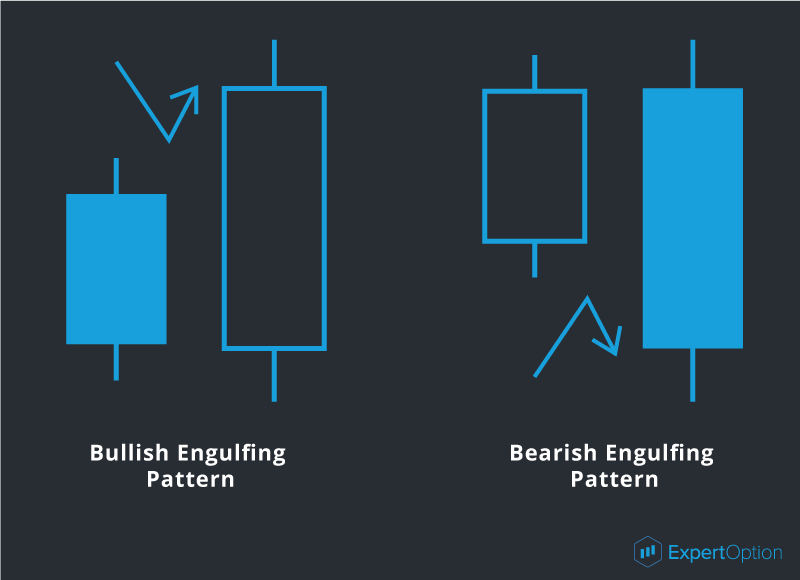
This candlestick signalizes the soonest tendency reversal.
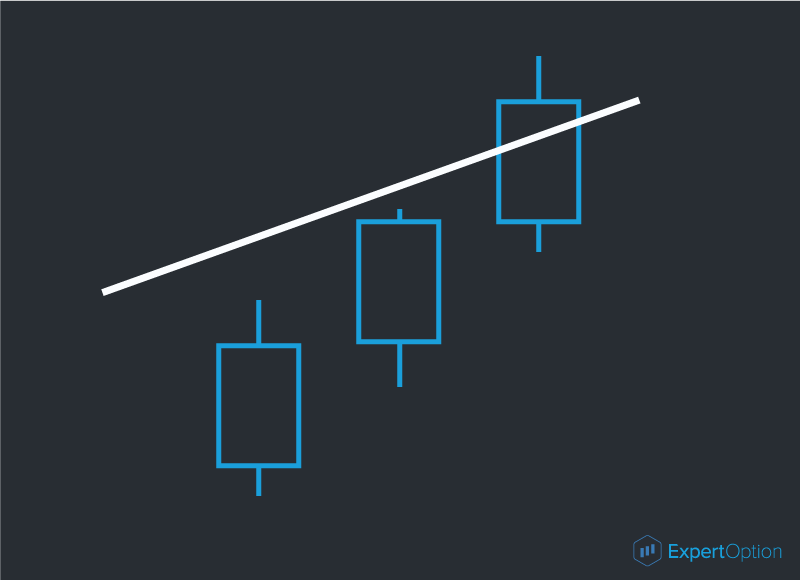
When analyzing the candlestick chart you should consider the real body, size, and form of the candlestick that helps you to foresee the market situation. You can start analyzing the candlestick only after its formation, i. e. when the interval ends. So you can receive the true signal and use it correctly. The candlesticks also give us signals when their real bodies penetrate the strong levels.
The strong level of penetration is a moment when the candlestick's real body has broken this level and closed behind it. On the chart, it looks as follows:
If at least 2/3 of the candlestick body has crossed the line, it'll be a strong signal of the strength level penetration.
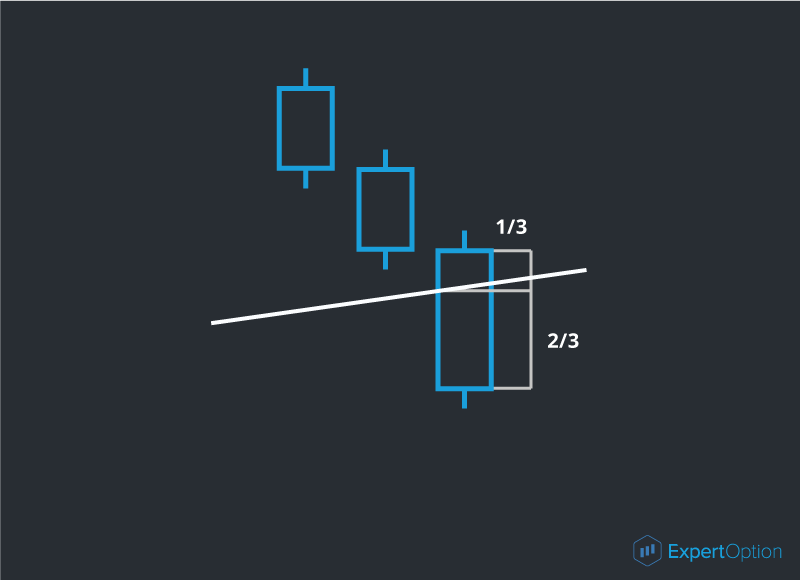
When we see this signal we can expect further price movement outside of this level.
But you should always remember about signal confirmation when working with the candlestick analysis. The signal confirmation will be the next candlestick moving in the signal direction. So if you see the candlestick closed behind the strength level, you should wait for the next candlestick with the same direction. Otherwise, you will receive a false penetration.
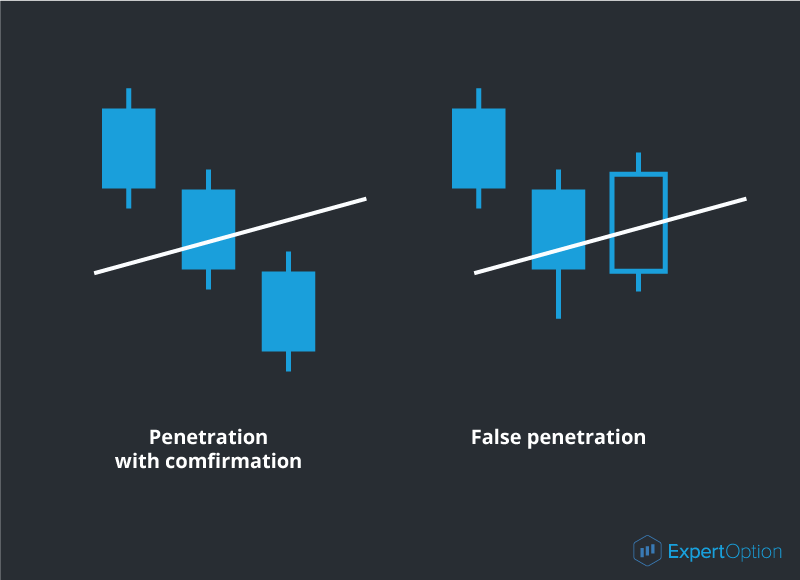
As we see in the picture, if there is no strong signal you should always wait for the confirmation. The candlestick analysis is simple to use and if you remember its basic rules you'll be able to foresee future price movements.