- Educação
- Análise Gráfica
- Padrões de Reversão de Tendência
Trend Reversal Patterns
The very important point in trading is understanding the moment when the tendency has become weak and is going to reverse. The reversal signal will be the breakout of the trend line. You need to understand if this signal is true and what the target price will be after the breakout. The reversal price formations can help answer this question.
The reversal pattern is the price movement signaling the tendency has become weak and is going to change its direction. Usually, the reversal patterns appear at the maximums or minimums of the price chart.
Let's look at the reversal patterns with a double bottom and a double top. These formations appear at strong levels when the price chart reaches them, cannot break out after two attempts, and then reverse.
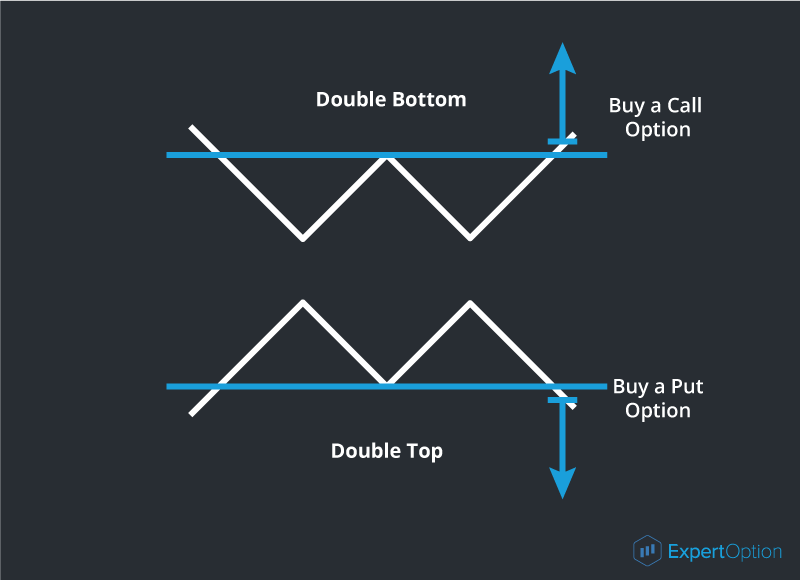
As we see in the picture, both formations look like an upturned letter “W”. Using this formation you can start trading after the price breaks out of the resistance line at the double bottom or the support line at the double top. After the breakout of these strong lines, you can expect the movement distance equal to the biggest formation height. Usually tops or bottoms of the formations are at the same level but sometimes there may be exceptions to the rule.
The other reversal patterns are a triple top and a triple bottom. These formations have the same principles as the double top and bottom.
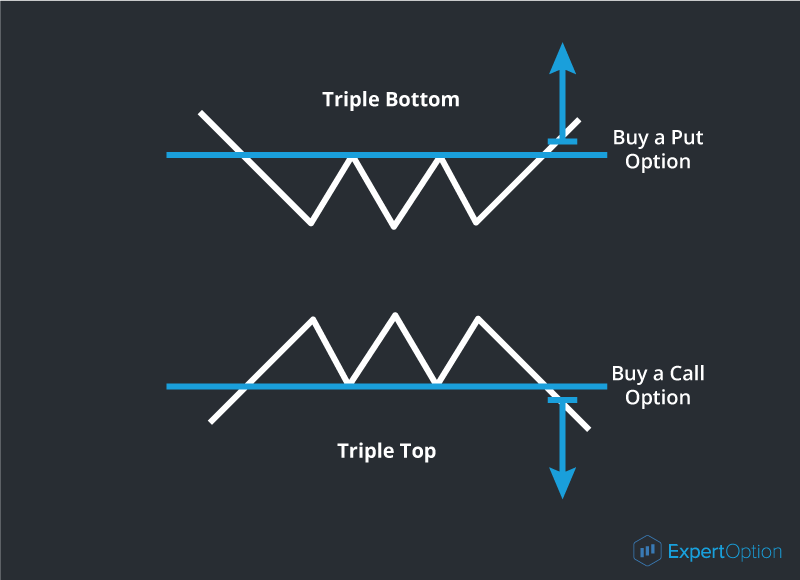
As in the case of the double tops and bottoms, a trading signal appears after the breakout of their strong levels. The price will move the distance equal to the biggest part of the formation.
The next formation indicating the tendency reversal is head and shoulders. The head and shoulders formation reminds a man shrugging his shoulders. This formation is one of the strongest reversal signals and is very popular among traders. The head and shoulders formation tells that the bullish tendency is changing into a bearish one.
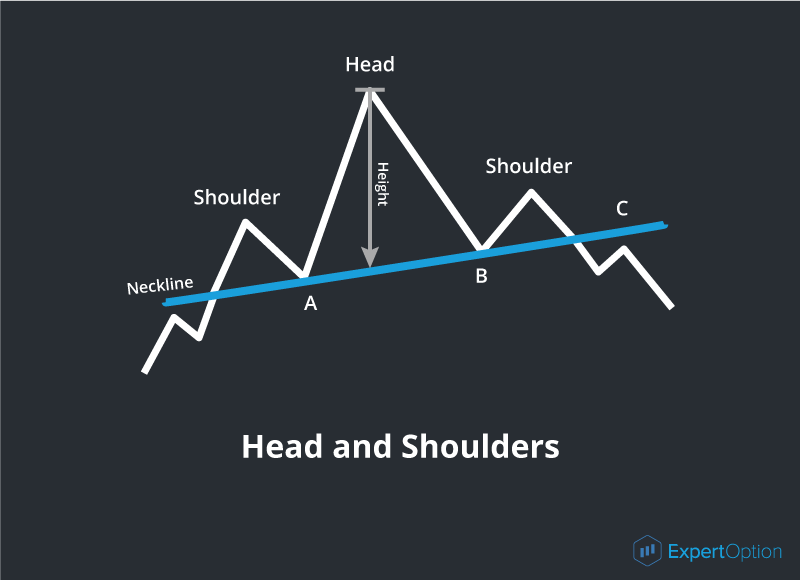
The model is formed of tops of different sizes, with the middle top being the highest one. It represents a head. The formation has a minimum of two shoulders but sometimes can have more shoulders on both sides. The line connecting minimums A and B is called a neckline and is the base-line. We usually see an ascending neckline on the uptrend and a descending neckline on the downtrend. After its breakout, the price can reverse to point C to confirm the neckline. When the neckline is confirmed we can consider that a price pattern has been formed. After the breakout, the price generally moves a distance equal to the head height. You can open a deal at the breakout point or point C. The upturned head and shoulders formation shows that the bearish tendency has changed to a bullish one. It works on the same but mirroring principles.
The rarest reversal formation is a diamond (rhomb) price pattern. It looks like two triangles connected at their bases. This rare formation is a strong reversal signal.
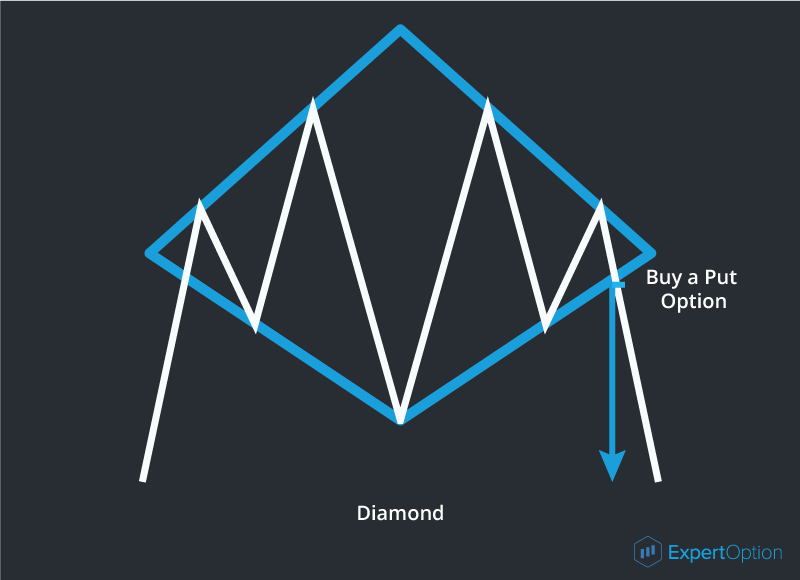
After the breakout, the price chart moves in the direction opposite to a price movement at the entry of the diamond formation.
The price target is usually the same as the formation height or the distance at which the price moved to reach the diamond pattern. As this price pattern is rare, its appearance on the chart will be strongly pronounced and easy to identify.
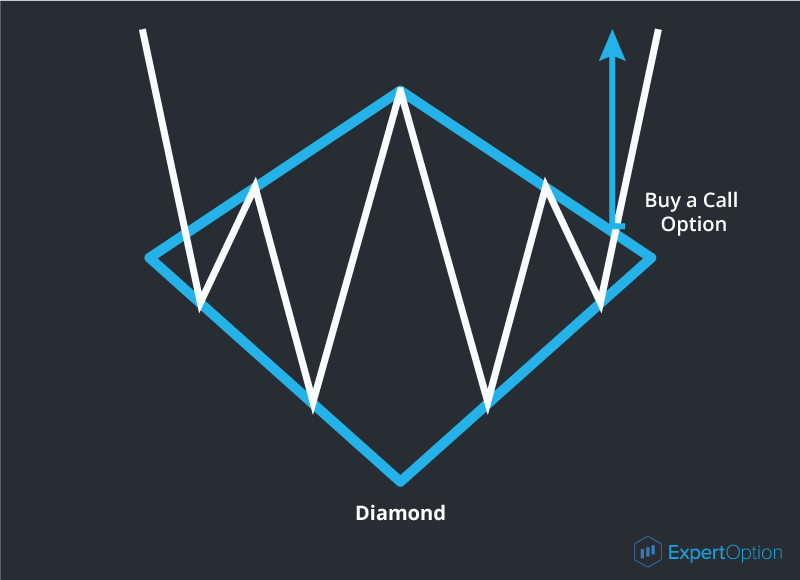
As we see in the picture, after the breakout of the diamond formation the descending tendency changed into the ascending tendency. So working with the technical analysis patterns is mostly subjective as traders decide for themselves what price formation they see. With experience, the trader will filter the formations that aren't the price chart patterns. We recommend to new traders to not look for price patterns where they don't appear. The more salient the price formation is the higher the chance the price will move as expected.